压测简介
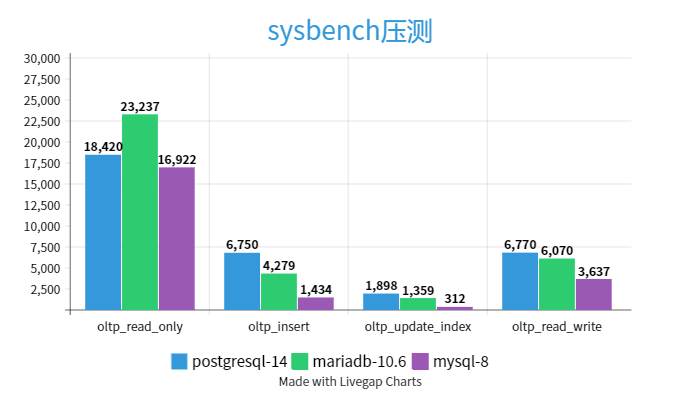
结果条形图
![sysbench压测]()
系统信息:
2C4G30G,ubuntu22.04 desktop,zfs-2.1.4,run in virtualbox
1
2
3
4
5
6
7
8
9
10
11
12
13
14
15
16
17
18
19
20
21
22
23
24
25
26
27
28
| Basic System Information:
---------------------------------
Uptime : 0 days, 2 hours, 26 minutes
Processor : AMD Ryzen 5 5600X 6-Core Processor
CPU cores : 2 @ 3699.994 MHz
AES-NI : ✔ Enabled
VM-x/AMD-V : ❌ Disabled
RAM : 3.8 GiB
Swap : 1.8 GiB
Disk : 30.0 GiB
Distro : Ubuntu 22.04 LTS
Kernel : 5.15.0-48-generic
Warning! You are running YABS on a ZFS Filesystem and your disk space is too low for the fio test. Your test results will be inaccurate. You need at least 48 GB free in order to complete this test accurately. For more information, please see https://github.com/masonr/yet-another-bench-script/issues/13
fio Disk Speed Tests (Mixed R/W 50/50):
---------------------------------
Block Size | 4k (IOPS) | 64k (IOPS)
------ | --- ---- | ---- ----
Read | 9.54 MB/s (2.3k) | 148.70 MB/s (2.3k)
Write | 9.58 MB/s (2.3k) | 149.48 MB/s (2.3k)
Total | 19.12 MB/s (4.7k) | 298.18 MB/s (4.6k)
| |
Block Size | 512k (IOPS) | 1m (IOPS)
------ | --- ---- | ---- ----
Read | 658.56 MB/s (1.2k) | 577.40 MB/s (563)
Write | 693.56 MB/s (1.3k) | 615.85 MB/s (601)
Total | 1.35 GB/s (2.6k) | 1.19 GB/s (1.1k)
|
压测方法:
sysbench 1.0.20,分别执行oltp_read_only、oltp_insert、oltp_update_index和oltp_read_write,共20个表,每个表200万行数据,每个测试持续10分钟
压测命令:
1
2
3
4
5
6
7
8
9
10
11
12
13
14
| # 预填充数据,postgresql
sysbench --db-driver=pgsql --table_size=2000000 --tables=20 --threads=5 --pgsql-host=127.0.0.1 --pgsql-port=5432 --pgsql-user=xxx --pgsql-password=xxx --pgsql-db=example oltp_read_only prepare
# 预填充数据,mysql/mariadb
sysbench --db-driver=mysql --table_size=2000000 --tables=20 --threads=5 --mysql-host=127.0.0.1 --mysql-user=xxx --mysql-password=xxx --mysql-db=example oltp_read_only prepare
# 压测,postgresql
sysbench --time=600 --forced-shutdown=1 --report-interval=3 --db-driver=pgsql --table_size=2000000 --tables=20 --threads=64 --pgsql-host=127.0.0.1 --pgsql-port=5432 --pgsql-user=xxx --pgsql-password=xxx --pgsql-db=example oltp_read_only run
# 压测,mysql/mariadb
sysbench --time=600 --forced-shutdown=1 --report-interval=3 --db-driver=mysql --table_size=2000000 --tables=20 --threads=64 --mysql-host=127.0.0.1 --mysql-user=xxx --mysql-password=xxx --mysql-db=example oltp_insert run
# 清理数据,postgresql
sysbench --time=600 --forced-shutdown=1 --report-interval=3 --db-driver=pgsql --table_size=2000000 --tables=20 --threads=64 --pgsql-host=127.0.0.1 --pgsql-port=5432 --pgsql-user=xxx --pgsql-password=xxx --pgsql-db=example oltp_read_only cleanup
# 清理数据,mysql/mariadb
sysbench --time=600 --forced-shutdown=1 --report-interval=3 --db-driver=mysql --table_size=2000000 --tables=20 --threads=64 --mysql-host=127.0.0.1 --mysql-user=xxx --mysql-password=xxx --mysql-db=example oltp_read_only cleanup
|
其他信息:
mysql8和mariadb的innodb_buffer_pool_size为2G,关闭binlog,压测mysql8时系统使用1G swap。mysql8在prepare阶段也十分耗时。
压测结果
postgresql 14.5.1:
oltp_read_only:
1
2
3
4
5
6
7
8
9
10
11
12
13
14
15
16
17
18
19
20
21
22
23
24
25
26
| SQL statistics:
queries performed:
read: 9674378
write: 0
other: 1382054
total: 11056432
transactions: 691027 (1151.26 per sec.)
queries: 11056432 (18420.20 per sec.)
ignored errors: 0 (0.00 per sec.)
reconnects: 0 (0.00 per sec.)
General statistics:
total time: 600.2337s
total number of events: 691027
Latency (ms):
min: 0.77
avg: 55.58
max: 1387.65
95th percentile: 127.81
sum: 38405357.10
Threads fairness:
events (avg/stddev): 10797.2969/316.69
execution time (avg/stddev): 600.0837/0.07
|
oltp_insert:
1
2
3
4
5
6
7
8
9
10
11
12
13
14
15
16
17
18
19
20
21
22
23
24
25
| SQL statistics:
queries performed:
read: 0
write: 4052903
other: 0
total: 4052903
transactions: 4052903 (6750.46 per sec.)
queries: 4052903 (6750.46 per sec.)
ignored errors: 0 (0.00 per sec.)
reconnects: 0 (0.00 per sec.)
General statistics:
total time: 600.3886s
total number of events: 4052903
Latency (ms):
min: 1.37
avg: 9.47
max: 374.92
95th percentile: 27.17
sum: 38397653.94
Threads fairness:
events (avg/stddev): 63326.6094/16.67
execution time (avg/stddev): 599.9633/0.06
|
oltp_update_index:
1
2
3
4
5
6
7
8
9
10
11
12
13
14
15
16
17
18
19
20
21
22
23
24
25
| SQL statistics:
queries performed:
read: 0
write: 1139170
other: 0
total: 1139170
transactions: 1139170 (1898.03 per sec.)
queries: 1139170 (1898.03 per sec.)
ignored errors: 0 (0.00 per sec.)
reconnects: 0 (0.00 per sec.)
General statistics:
total time: 600.1855s
total number of events: 1139170
Latency (ms):
min: 0.83
avg: 33.71
max: 610.54
95th percentile: 144.97
sum: 38405619.94
Threads fairness:
events (avg/stddev): 17799.5312/39.89
execution time (avg/stddev): 600.0878/0.04
|
oltp_read_write:
1
2
3
4
5
6
7
8
9
10
11
12
13
14
15
16
17
18
19
20
21
22
23
24
25
| SQL statistics:
queries performed:
read: 2846564
write: 813282
other: 406666
total: 4066512
transactions: 203322 (338.52 per sec.)
queries: 4066512 (6770.45 per sec.)
ignored errors: 4 (0.01 per sec.)
reconnects: 0 (0.00 per sec.)
General statistics:
total time: 600.6259s
total number of events: 203322
Latency (ms):
min: 4.43
avg: 188.99
max: 1429.36
95th percentile: 539.71
sum: 38425368.60
Threads fairness:
events (avg/stddev): 3176.9062/24.03
execution time (avg/stddev): 600.3964/0.06
|
mariadb 10.6
oltp_read_only:
1
2
3
4
5
6
7
8
9
10
11
12
13
14
15
16
17
18
19
20
21
22
23
24
25
| SQL statistics:
queries performed:
read: 12200972
write: 0
other: 1742996
total: 13943968
transactions: 871498 (1452.34 per sec.)
queries: 13943968 (23237.49 per sec.)
ignored errors: 0 (0.00 per sec.)
reconnects: 0 (0.00 per sec.)
General statistics:
total time: 600.0633s
total number of events: 871498
Latency (ms):
min: 0.91
avg: 44.06
max: 1009.45
95th percentile: 81.48
sum: 38400574.47
Threads fairness:
events (avg/stddev): 13617.1562/364.23
execution time (avg/stddev): 600.0090/0.02
|
oltp_insert:
1
2
3
4
5
6
7
8
9
10
11
12
13
14
15
16
17
18
19
20
21
22
23
24
25
| SQL statistics:
queries performed:
read: 0
write: 2567981
other: 0
total: 2567981
transactions: 2567981 (4279.61 per sec.)
queries: 2567981 (4279.61 per sec.)
ignored errors: 0 (0.00 per sec.)
reconnects: 0 (0.00 per sec.)
General statistics:
total time: 600.0501s
total number of events: 2567981
Latency (ms):
min: 0.75
avg: 14.95
max: 1847.06
95th percentile: 40.37
sum: 38394877.35
Threads fairness:
events (avg/stddev): 40124.7031/192.95
execution time (avg/stddev): 599.9200/0.01
|
oltp_update_index:
1
2
3
4
5
6
7
8
9
10
11
12
13
14
15
16
17
18
19
20
21
22
23
24
25
| SQL statistics:
queries performed:
read: 0
write: 816264
other: 0
total: 816264
transactions: 816264 (1359.74 per sec.)
queries: 816264 (1359.74 per sec.)
ignored errors: 0 (0.00 per sec.)
reconnects: 0 (0.00 per sec.)
General statistics:
total time: 600.3067s
total number of events: 816264
Latency (ms):
min: 0.74
avg: 47.06
max: 3193.30
95th percentile: 253.35
sum: 38415975.04
Threads fairness:
events (avg/stddev): 12754.1250/210.20
execution time (avg/stddev): 600.2496/0.09
|
oltp_read_write:
1
2
3
4
5
6
7
8
9
10
11
12
13
14
15
16
17
18
19
20
21
22
23
24
25
| SQL statistics:
queries performed:
read: 2550282
write: 728652
other: 364326
total: 3643260
transactions: 182163 (303.54 per sec.)
queries: 3643260 (6070.75 per sec.)
ignored errors: 0 (0.00 per sec.)
reconnects: 0 (0.00 per sec.)
General statistics:
total time: 600.1321s
total number of events: 182163
Latency (ms):
min: 2.12
avg: 210.81
max: 4684.89
95th percentile: 816.63
sum: 38402375.34
Threads fairness:
events (avg/stddev): 2846.2969/35.68
execution time (avg/stddev): 600.0371/0.03
|
mysql8:
oltp_read_only:
1
2
3
4
5
6
7
8
9
10
11
12
13
14
15
16
17
18
19
20
21
22
23
24
25
| SQL statistics:
queries performed:
read: 890778
write: 0
other: 127254
total: 1018032
transactions: 63627 (1057.67 per sec.)
queries: 1018032 (16922.72 per sec.)
ignored errors: 0 (0.00 per sec.)
reconnects: 0 (0.00 per sec.)
General statistics:
total time: 60.1573s
total number of events: 63627
Latency (ms):
min: 1.25
avg: 60.40
max: 1002.54
95th percentile: 125.52
sum: 3843151.94
Threads fairness:
events (avg/stddev): 994.1719/81.66
execution time (avg/stddev): 60.0492/0.03
|
oltp_insert:
1
2
3
4
5
6
7
8
9
10
11
12
13
14
15
16
17
18
19
20
21
22
23
24
25
| SQL statistics:
queries performed:
read: 0
write: 86893
other: 0
total: 86893
transactions: 86893 (1434.97 per sec.)
queries: 86893 (1434.97 per sec.)
ignored errors: 0 (0.00 per sec.)
reconnects: 0 (0.00 per sec.)
General statistics:
total time: 60.5538s
total number of events: 86893
Latency (ms):
min: 0.95
avg: 44.57
max: 2114.74
95th percentile: 54.83
sum: 3873199.66
Threads fairness:
events (avg/stddev): 1357.7031/21.35
execution time (avg/stddev): 60.5187/0.01
|
oltp_update_index:
1
2
3
4
5
6
7
8
9
10
11
12
13
14
15
16
17
18
19
20
21
22
23
24
25
| SQL statistics:
queries performed:
read: 0
write: 19059
other: 0
total: 19059
transactions: 19059 (312.75 per sec.)
queries: 19059 (312.75 per sec.)
ignored errors: 0 (0.00 per sec.)
reconnects: 0 (0.00 per sec.)
General statistics:
total time: 60.9397s
total number of events: 19059
Latency (ms):
min: 0.87
avg: 204.43
max: 3006.09
95th percentile: 1050.76
sum: 3896151.58
Threads fairness:
events (avg/stddev): 297.7969/15.31
execution time (avg/stddev): 60.8774/0.05
|
oltp_read_write:
1
2
3
4
5
6
7
8
9
10
11
12
13
14
15
16
17
18
19
20
21
22
23
24
25
26
27
| SQL statistics:
queries performed:
read: 155540
write: 44207
other: 22157
total: 221904
transactions: 11047 (181.10 per sec.)
queries: 221904 (3637.71 per sec.)
ignored errors: 0 (0.00 per sec.)
reconnects: 0 (0.00 per sec.)
Number of unfinished transactions on forced shutdown: 64
General statistics:
total time: 61.0006s
total number of events: 11047
Latency (ms):
min: 5.98
avg: 346.17
max: 3443.49
95th percentile: 1589.90
sum: 3824104.87
Threads fairness:
events (avg/stddev): 173.6094/5.95
execution time (avg/stddev): 59.7516/1.26
|